
Forecast Methodology
Last Updated: July 2026
At SaharanDust.com, our goal is to provide clear, reliable, and easy-to-understand forecasts of Saharan dust movement across the Atlantic Ocean, Caribbean, Florida, Central America, and surrounding regions.
This page explains how our forecasts are created, the scientific data that powers them, their limitations, and how you should interpret the information presented on our website.
Understanding how forecasts are generated helps readers make better decisions while appreciating both the strengths and limitations of atmospheric prediction.
Our Forecasting Philosophy
Saharan dust is a naturally occurring atmospheric phenomenon that travels thousands of kilometres across the Atlantic each year.
Forecasting its movement requires combining multiple sources of scientific information, atmospheric models, satellite observations, and meteorological expertise.
Rather than relying on a single dataset, SaharanDust.com combines multiple trusted data sources and visualization techniques to present forecasts that are practical, informative, and accessible.
Our objective is not simply to display model output, but to help users understand what that information means for their location.
How Saharan Dust Travels
Every year, powerful winds lift millions of tons of mineral dust from the Sahara Desert in North Africa.
Once airborne, this dust becomes embedded within a warm, dry layer of air known as the Saharan Air Layer (SAL).
Trade winds transport this air mass westward across the Atlantic Ocean where it may affect:
- Cape Verde
- The Caribbean
- Florida
- The Gulf of Mexico
- Central America
- Northern South America
- Occasionally the southeastern United States
Depending on weather conditions, individual dust plumes may travel more than 8,000 kilometres before dissipating.
Forecasting these movements requires understanding both the dust itself and the atmospheric conditions transporting it.
Every forecast published on SaharanDust.com follows a structured workflow.
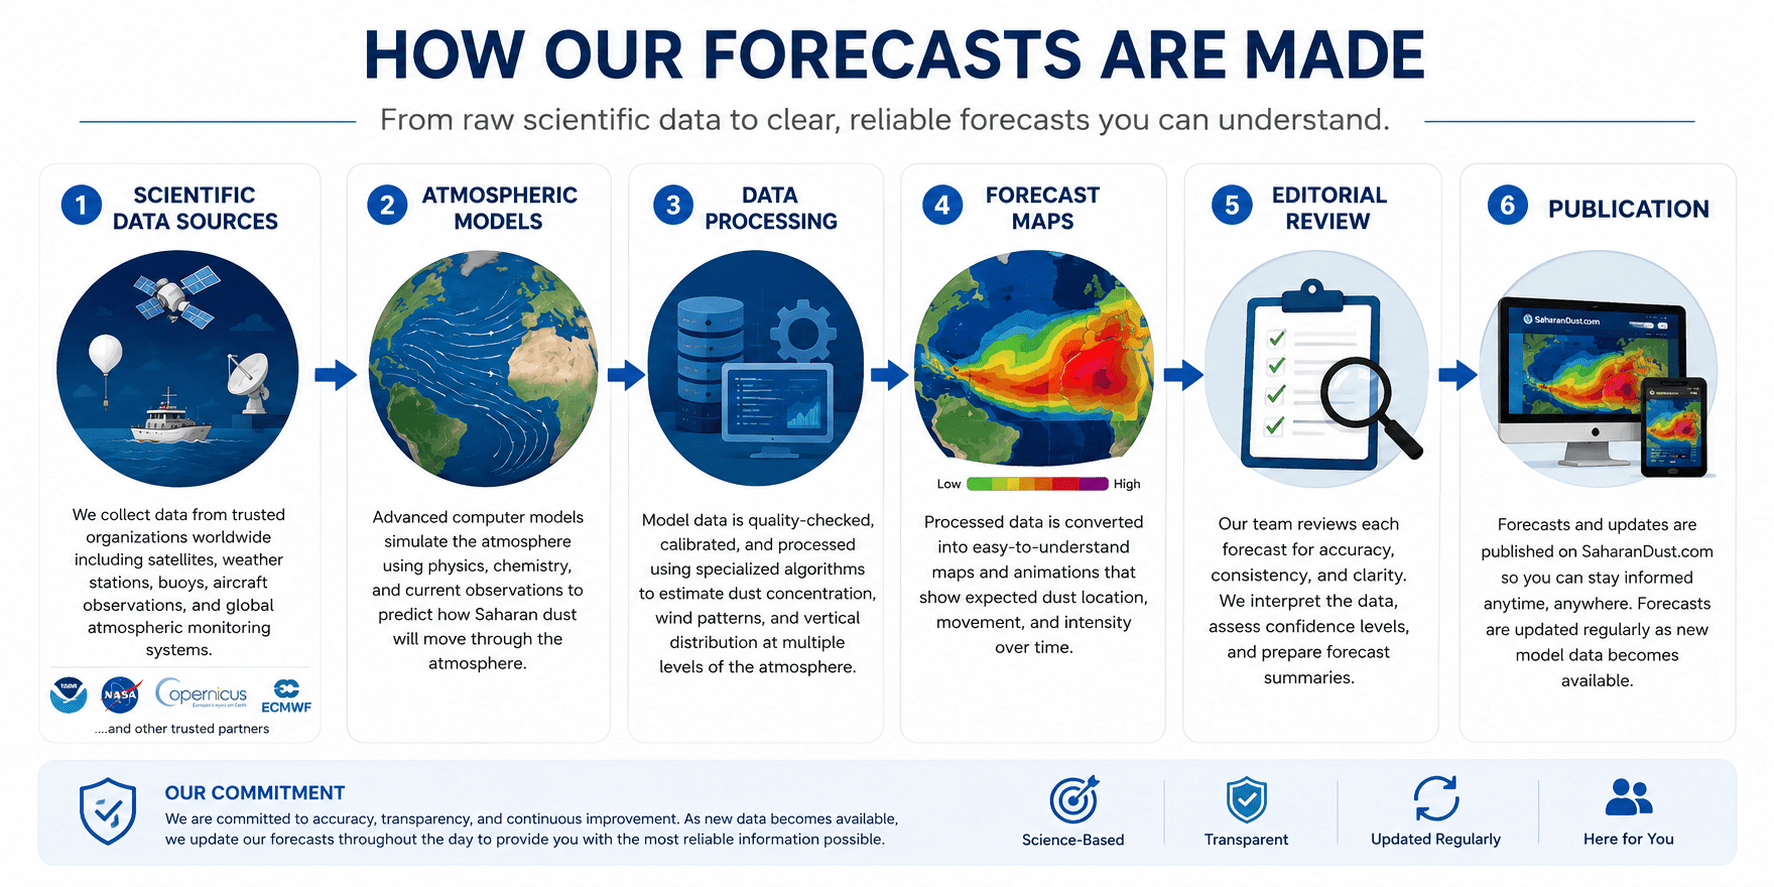
Step 1 – Collect Atmospheric Data
We begin by retrieving atmospheric forecast data from internationally recognized meteorological sources.
These datasets include information such as:
- dust concentration
- wind speed
- wind direction
- atmospheric pressure
- temperature
- humidity
- precipitation
- aerosol transport
These variables form the foundation of every forecast.
Step 2 – Process Forecast Models
Atmospheric models simulate how dust particles move through the atmosphere over time.
These models account for factors including:
- upper-level winds
- surface winds
- atmospheric stability
- vertical mixing
- moisture
- rainfall
- turbulence
- changing weather systems
Each model run produces forecast fields extending several days into the future.
As newer model runs become available, forecast guidance is updated accordingly.
Step 3 – Generate Forecast Maps
Raw scientific data is difficult for most users to interpret.
To make forecasts easier to understand, numerical model output is converted into visual forecast maps.
These maps illustrate:
- expected dust location
- relative concentration
- movement over time
- forecast progression
- regional impacts
Maps are designed to provide an intuitive overview rather than precise measurements for individual addresses.
Step 4 – Forecast Interpretation
Model data alone does not always provide useful context.
Forecast narratives summarize the expected evolution of dust events, highlighting:
- the most affected regions
- increasing or decreasing concentrations
- expected arrival times
- notable atmospheric changes
- forecast confidence
Our goal is to translate complex atmospheric information into practical guidance.
Step 5 – Publication
Once forecast products have been generated and reviewed, they are published on SaharanDust.com.
Forecasts may be updated throughout the day whenever newer model guidance becomes available.
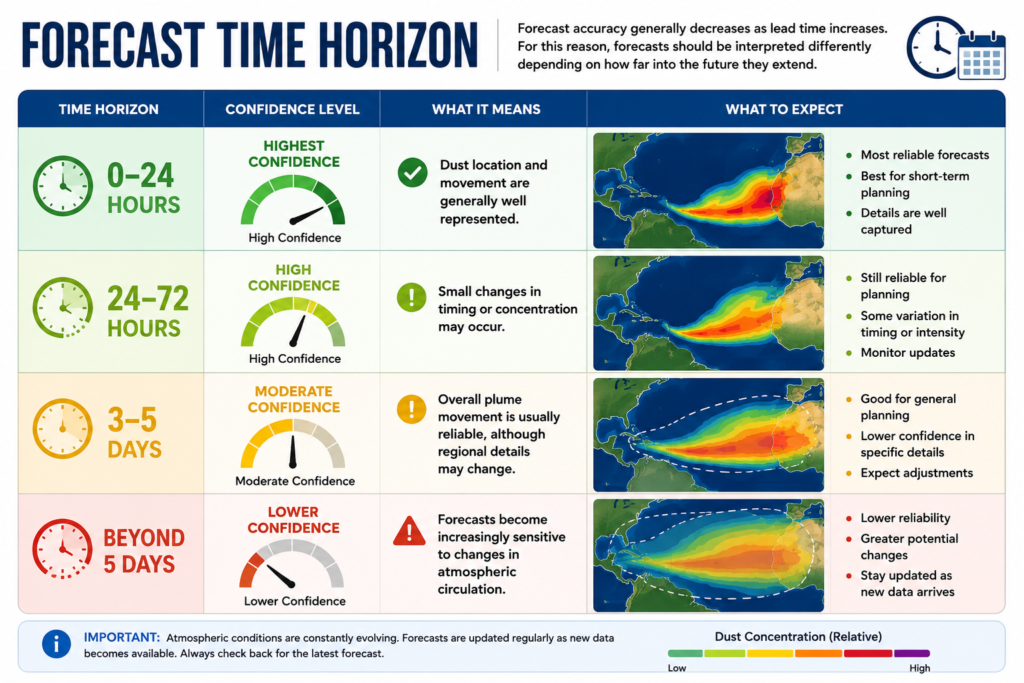
Forecast Time Horizon
Understanding Dust Concentration
Dust concentration maps display the estimated amount of airborne mineral dust within the atmosphere.
Colours represent relative concentration levels rather than direct health categories.
Generally:
- Green indicates very low concentrations.
- Yellow indicates light dust.
- Orange indicates moderate dust.
- Red indicates high concentrations.
Actual air quality experienced at ground level may differ depending on:
- local weather
- rainfall
- elevation
- vertical mixing
- terrain
- local pollution
Forecast maps should therefore be viewed as regional guidance.
Why Forecasts Change
Many users wonder why forecasts sometimes look different from one day to the next.
This is normal.
Atmospheric forecasting is dynamic.
New observations from satellites, weather stations, aircraft, balloons, ships, and ocean buoys are continually incorporated into forecasting models.
Each new model run begins with improved information, which naturally produces updated forecasts.
Changes in:
- tropical waves
- rainfall
- wind patterns
- pressure systems
- hurricanes
- thunderstorms
can all alter dust transport. Forecast updates are therefore an expected part of modern meteorology.
Satellite Observations
Satellite imagery plays an important role in monitoring existing dust plumes.
Satellites allow meteorologists to observe:
- plume extent
- cloud cover
- aerosol movement
- atmospheric moisture
- large-scale weather systems
While satellites provide excellent real-time observations, they do not directly predict future movement.
Forecast models combine satellite observations with atmospheric physics to estimate future conditions.
Forecast Confidence
Not every forecast carries the same level of certainty.
Confidence depends on factors such as:
- agreement between atmospheric models
- stability of weather patterns
- forecast lead time
- tropical cyclone activity
- rainfall distribution
- observational data availability
Periods of stable trade winds generally produce higher confidence.
Rapidly changing weather patterns may reduce forecast certainty.
Regional Differences
Dust does not affect every location equally.
Even neighbouring islands may experience noticeably different conditions.
Local factors include:
- elevation
- sea breezes
- convection
- rainfall
- topography
- local wind patterns
Because of these influences, actual conditions may vary within relatively short distances.
Health Considerations
Our forecasts identify where elevated dust concentrations are expected.
However, individuals respond differently to airborne particles.
People with:
- asthma
- allergies
- chronic respiratory disease
- cardiovascular conditions
may experience symptoms at lower concentrations than others.
Forecast maps should not replace guidance from local health authorities.
Model Limitations
Every atmospheric model has limitations.
Models simplify highly complex physical processes and cannot perfectly predict future weather.
Sources of uncertainty include:
- incomplete observations
- rapidly changing weather
- model resolution
- aerosol physics
- precipitation timing
- local atmospheric effects
For these reasons, forecast maps should always be interpreted as guidance rather than exact predictions.
Continuous Improvement
Forecasting technology continues to evolve.
As new datasets, higher-resolution models, and improved atmospheric research become available, SaharanDust.com will continue refining its forecasting system.
Areas of ongoing development include:
- higher-resolution maps
- improved animation
- additional forecast layers
- expanded regional coverage
- enhanced visualization
- improved mobile performance
- greater forecast detail
Our objective is to continually improve both forecast quality and user experience.
Data Updates
Forecast data is refreshed regularly as new model guidance becomes available.
During active dust events, multiple updates may occur within a single day.
Forecast timestamps are displayed so readers know when products were last updated.
Older forecasts are retained for historical reference where appropriate.
Our Commitment to Transparency
We believe readers deserve to understand how forecasts are created.
Rather than presenting maps without explanation, we strive to provide clear information about:
- where our data comes from
- how forecasts are generated
- what confidence users should have
- why forecasts change
- the limitations of atmospheric modelling
Transparency builds trust and helps users make informed decisions.
Final Notes
Saharan dust forecasting is an evolving science.
Although modern atmospheric models provide remarkably accurate guidance, no forecast can predict future conditions with complete certainty.
At SaharanDust.com, our commitment is to present the best available scientific information in a way that is accurate, transparent, and easy to understand.
Whether you are planning travel, monitoring air quality, preparing for outdoor activities, or simply curious about the atmosphere, our forecasts are designed to help you better understand the movement of Saharan dust across the Atlantic and the communities it affects.
We remain committed to continually improving our forecasting methods while maintaining the highest standards of scientific integrity, transparency, and public service.